1. There are a number of Pie Chart reports available, from the Main Management Menu at Reports > Productivity > Pie Charts.
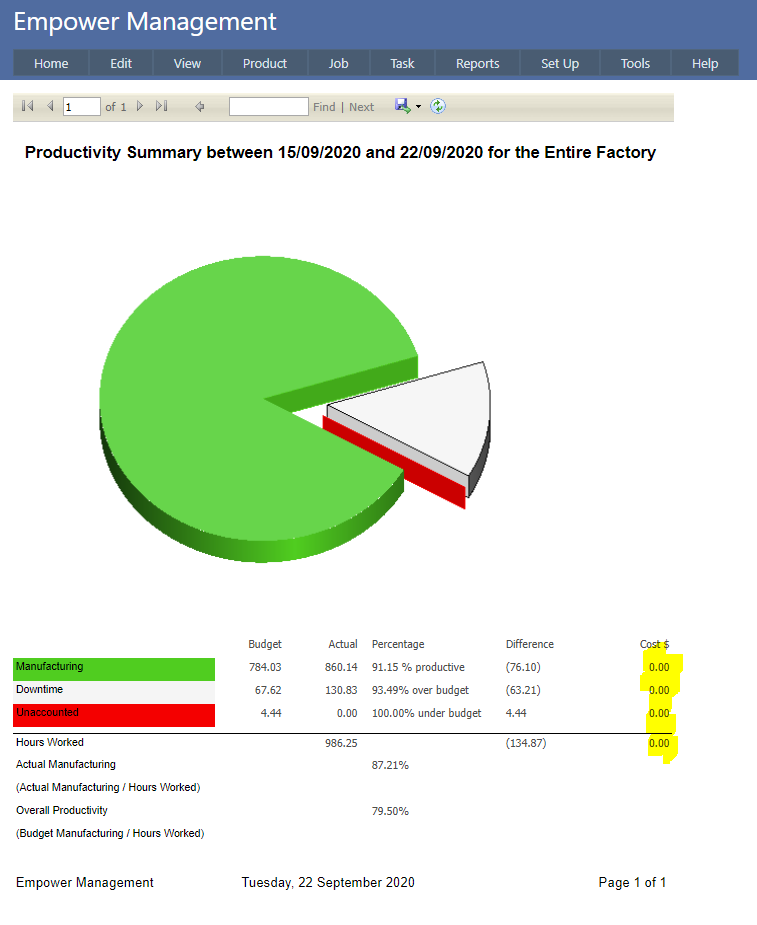
These reports provide a graphical representation of the number of hours worked and how it is split up between Manufacturing, Downtime and Unaccounted time.
2. An example is shown below
3. In addition to the Entire Factory (as displayed above) Pie Charts are also available
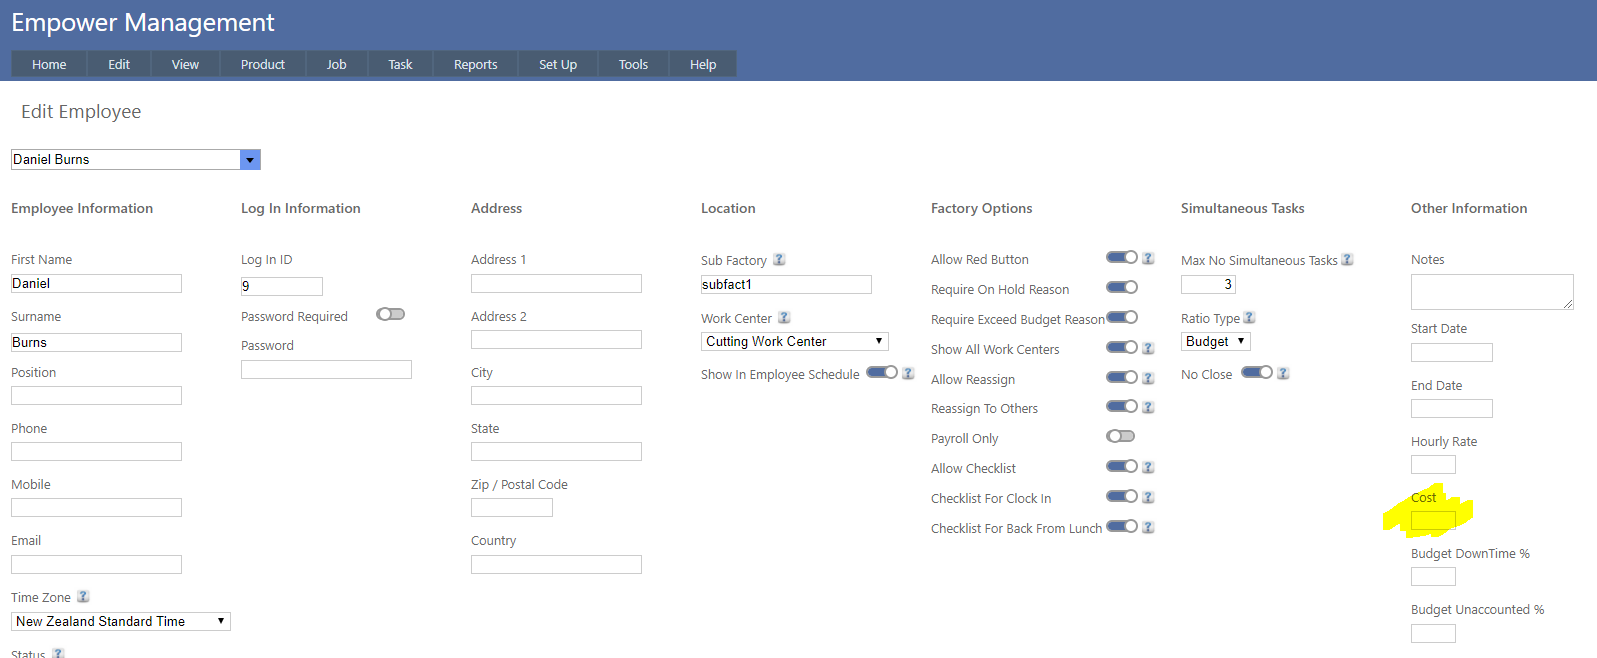
4. It is possible to add cost dollars (highlighted above) which is the difference of the Actual and Budget of hours multiplied by each Employee's cost.
The Employee cost is visible in the Set Up > Employee page (see highlighted below)
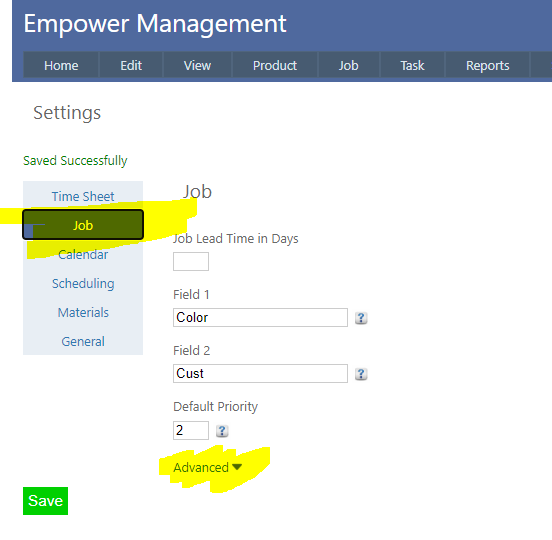
5. This calculation can be enabled or disabled for each of the reports listed above.
To do this, from the Main Management Menu select Tools > Settings and then select the Job Tab (see highlighted below).
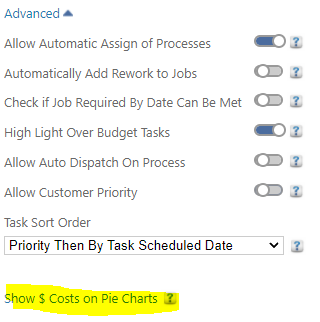
Then click on Advanced (see highlighted above).
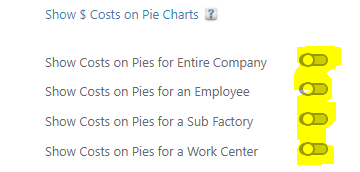
Then click on Show $ Costs on Pie Charts (see highlighted above).
And finally - select the reports you wish to show the costs on (see highlighted below).
Note that only Administrators can switch these on and off.